The Look of Harmonic Distortion
adapted and expanded from Steve Bench
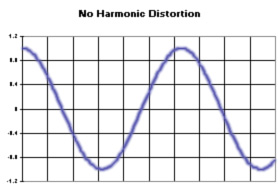
Fig. 1: Pure sine wave, smoothly symmetrical.
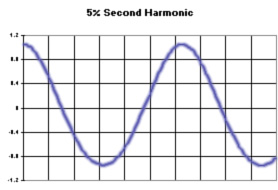
Fig. 2: Add 5% second harmonic: Waveform top narrows, bottom widens, waveform retain smoothness. Asymmetry correlates to distortion.
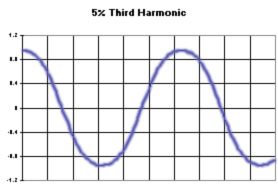
Fig. 3: Odd order harmonics (3rd, 5th, etc.) cause symmetrical distortion. Adding 5% third harmonic retains smoothness but fattens both top and bottom of wave crests.
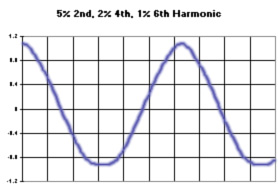
Fig. 4: Higher, even-order harmonics appear more evidently. Adding 5% 2nd-, 2% 4th-, and 1% 6th-order harmonics causes sharper top crests and flatter bottom troughs that indicate higher order distortion components.
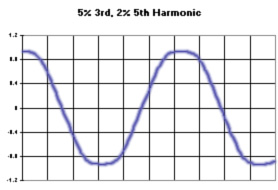
Fig. 5: With 5% 3rd-, and 2% 5th-order harmonics, symmetrical distortion indicates the presence of odd-order harmonics, and the flatened crests indicate higher-order components.
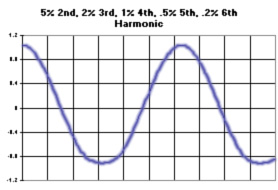
Fig. 6: Most amps suffer both even- and odd-order distortions. With 5% 2nd-, 2% 3rd-, 1% 4th-, 0.5% 5th- and 0.2% 6th-order harmonics, the result looks better than the less overall but more concentrated THD shown in Fig. 5.
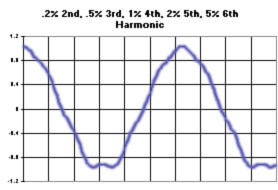
Fig. 7: Reversing the distortion spectrum (THD 0.2% 2nd-, 0.5% 3rd-, 1% 4th-, 2% 5th- and 5% 6th-order harmonics).
While the THD in Figs. 6 and 7 measure the same, the characteristic of Fig. 7 looks and sounds much worse. A distortion spectrum of decreasing amplitudes with increasing harmonic orders definitely looks and apparently sounds better than one in which higher harmonics predominate, even with lower overall THD.
Interestingly, the Radiotron Designer's Handbook (the big red bible) notes that most listeners only begin to positively identify distortion as the composite THD reaches 5%, with only some listeners noticing slight distortion at 3% THD. In 1945, they were of course listening on tube amps; it may be that people listening on transistorized amps can detect lower overall THD not so much for any difference in quality but due more to the widely different harmonic spectra between the tubed and transistorized amps.
Just as knowing speaker power handling capability without also knowing speaker sensitivity is relatively meaningless, knowing THD without harmonic distortion spectral distribution is at best misleading. Composite THD figures appear to be wild oversimplifications--it's audible to almost everyone that 5% of 3rd-order harmonic distortion sounds dramatically much worse than 5% of 2nd-order harmonic distortion. And just as each instrument has its own unique spectral signature that can vary over time and with stimuli, so too do amplifiers and the complex systems they form with wires, speakers, enclosures and listening environments. Seen in this light, amplifiers are every bit as much a scientific instrument and a work of art as any other system component.
Waveform equation: y = cos(x) + (cos(2*x)*(%of 2nd)) - (cos(3*x)*(%of 3rd)) + (cos(4*x)*(%of 4th)) - (cos(5*x)*(%of 5th)) + (cos(6*x)*(%of 6th))
Material herein added and updated constantly; presented for inspirational and educational purposes per Fair Use.
Last modified 16 Feb 2024
